Theresa Fulton
Cornell University
Martin Matute
Montana State University,
Dept of Plant Science and Plant Pathology
Deana Namuth-Covert
University of Nebraska-Lincoln,
Dept of Agronomy and Horticulture
2014
Molecular Markers (variants of DNA sequences) are identifiers (or ‘tags’) of certain aspects of a phenotype and /or genotype which could be exploited by plant breeders for incorporating desirable traits into their advancing germplasm. It is important therefore that we understand the proper usage of markers, be able to select the proper marker types, have an understanding of DNA extraction protocols and the general organization of the crop genome of interest.
This lesson is written for plant breeders who are interested in or beginning to use molecular markers.
Objectives
At the end of this lesson you will (be)
This eLesson module ends with a summary and a quiz which randomly pulls questions from a quiz bank. If you correctly answer 70% of the 10 quiz questions correctly, you will earn an electronic badge of completion which will be emailed to you directly. You may retake the quiz, as you wish. On average, it will take participants approximately 45-60 mins to complete this module including the quiz.
This eLesson was supported in part by XXXXXX, administered by XXXXX. Any opinions, findings, conclusions or recommendations expressed in this publication are those of the author(s) and do not necessarily reflect the views of XXXXXXX.
Molecular marker technology enables plant breeders to select individual plants based on their marker pattern (genotype) rather than their observable traits (phenotype). This process is called marker assisted breeding (MAB) or marker assisted selection (MAS). MAB offers many benefits, including speeding up a plant breeding program’s progress, increasing accuracy and efficiency, and decreasing costs.
|
|
This animation goes through an example of MAS in developing wheat resistant to a disease. It outlines the guidelines for planting yieldgard rootworm (YGRW) corn using an Insecticide Resistance Management (IRM) plan. Different field planting options are illustrated within the animation. Note the population of resistant and susceptible beetles and mating between resistant and susceptible beetles. The planting strategy consists of a refuge, road or ditch and an adjacent field. |
If you are new to these concepts or need a refresher on the basic principles, we suggest you go through an eLesson written by Pat Byrne (Colorado State University) and Kelley Richardson (Oregon State University) entitled, “Marker-Assisted Selection”
In this eLesson Byrne and Richardson (2005) explain what MAS is and then give a comprehensive overview of the MAS process:
Marker-assisted selection (MAS) is a method of selecting desirable individuals in a breeding scheme based on DNA molecular marker patterns instead of, or in addition to, their trait values. When used in appropriate situations, it is a tool that can help plant breeders select more efficiently for desirable crop traits. However, MAS is not always advantageous, so careful analysis of the costs and benefits relative to conventional breeding methods is necessary.
Different marker types have variable characteristics. Desirable qualities of molecular markers include the following:
Until recently there were a number of marker types available, including RAPDs (Random Amplification of Polymorphic DNA), AFLPs (Amplified Fragment Length Polymorphism), ESTs (Expressed Sequence Tags), etc. For the most part these older markers are now obsolete because they did not meet these criteria as well as newer markers do. The 2 main marker types used today are:
SNPs have many advantages, including being high-throughput and low in cost. SSRs are an older type of marker but since they are being used as of this writing, we will also discuss them.
Obtaining plant DNA of sufficient quality and quantity is an important consideration for MAB. Figure 1 shows a step in a DNA extraction procedure.
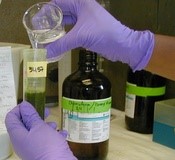 |
Figure 1: A Laboratory technician carefully adds chloroform to a large DNA extraction prep. (Image provided by Theresa Fulton.) |
There are many DNA extraction protocols available. No matter the protocol chosen, though, each will follow these four main steps summarized nicely in Wikipedia (http://en.wikipedia.org/wiki/DNA_extraction):
 |
This DNA Extraction animation visually depicts these laboratory steps (Sherman and Quinn). |
 |
While watching this next animation by Hain and Ehly (2000), which focusses on DNA structure, note the order/sequence of events: |
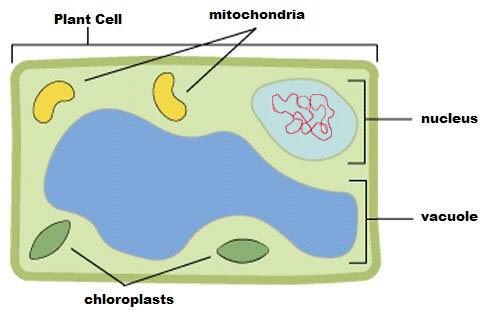 |
Figure 2: A plant cell diagram illustrating various components. DNA is normally extracted from chromosomes found within the nucleus. |
Which DNA extraction protocol you decide to use depends on the quality and quantity of DNA needed, the type of assay you want to utilize, and the number of markers needed. Here is a list of 3 common protocols and each of their advantages:
Figure 3 shows an example of the FTA card, where liquid from a leaf sample is eluted on to the card, and a punched disk is used to extract DNA and an example of a Qiagen kit, with all the ingredients needed to extract DNA from a leaf sample included.
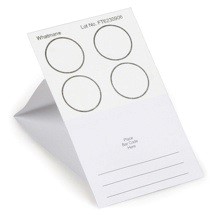  |
Figure 3 Top: Examples of DNA extraction protocol kits. Images taken from company websites as previously mentioned.
Figure 3 Bottom: |
For a more indepth discussion and/or review of DNA in general and how the extraction process works, please refer to eLesson, “DNA and DNA Extraction” by Patricia Hain and Donald Lee.
To be able to appropriately select and use markers in plant breeding programs, it is important to understand how these markers are designed and how they are able to identify specific areas of the genome.
The key concepts to understanding this include:
We’ll now take a closer look at each of these three concepts, starting first with the Structure of DNA.
DNA Structure
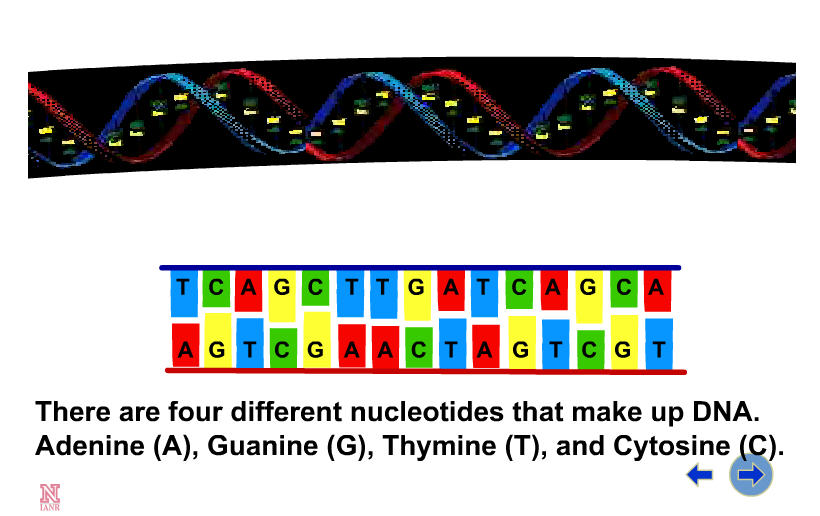
Each DNA strand is composed of a string of nucleotides, which are formed from a pentose sugar, a phosphate group, and either adenine, guanine, thymine or cytosine (abbreviated as A, G, T, or C). Notice in Figure 4 that the shapes of the A and the T molecules (and similarly of the C and the G) are "complementary" to one another, a property which allows them to bind to each other. When DNA is copied ("replicated"), the sequence of the new strand is complementary to that of the old one. Complementarity also lies behind the ability of the two strands to form the double helix structure of DNA. The order of the four bases (A, T, C and G) in the DNA sequence of each individual organism is unique. It carries all the genetic information needed for the organism to function. These illustrations (Figure 4) from the Human Genome Project Information site (http://www.doegenomes.org/ ) show two views of the structure of DNA.
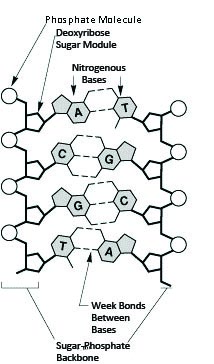
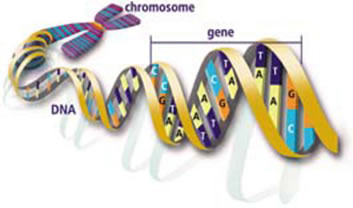
Figure 4: The DNA structure is a double stranded double helix with nucleotide bases.
Image from the Human Genome Project Information site (http://www.doegenomes.org/).
DNA Organization
This now takes us to the second key concept, the organization of DNA in a plant’s genome. It is important to remember that only part (sometimes a very small part!) of the DNA sequence is composed of genes. The rest is non-coding sequence, including lots of repetitive sequences, microsatellites and transposons. In some species, the genic fraction of the genome may be <10% of the total. Figure 5 illustrates this concept.
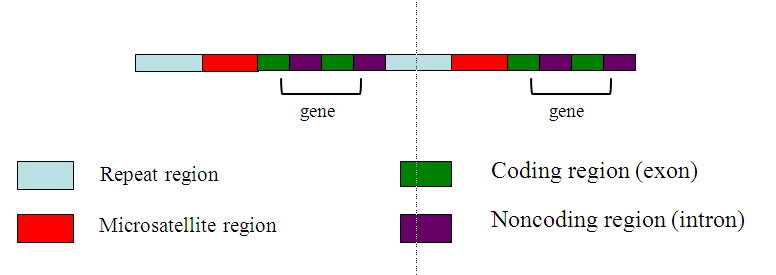
Figure 5: This sketch shows how an area of the chromosome consists of other motifs in addition to genes. Genes themselves may include both introns (non-coding regions that will be excised during transcription) and exons (regions that are transcribed and become proteins). Non-genic regions of repeated nucleotides are scattered throughout the genome, including microsatellites, a type of repeat.
(Image by Theresa Fulton.)
Now to our third key concept, the lab procedure called polymerase chain reaction. The vast majority of molecular markers rely on the use of PCR (Mullis et al. 1986).
This process mimics the natural way in which the cell replicates its DNA. It provides a quick, inexpensive way of making a large number (millions) of copies of a specific DNA segment.
A sample of DNA that you wish to be copied (the "template") is mixed with DNA polymerase and short targeted priming sequences ("primers") . Then, cycling through various temperatures leads to the production of a copy of the part of the template DNA sequence between the two primers. Reiterating the cycle many times allows the new copies to serve as templates in the next round, resulting in an exponential increase in copy number of the target sequence.
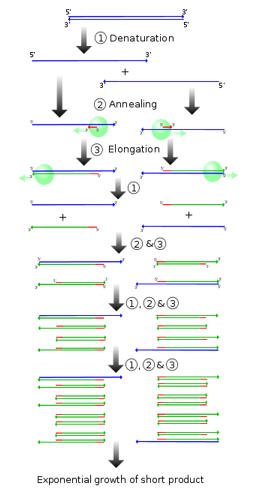 |
Figure 6: An illustration of the cyclic nature of the PCR process. http://upload.wikimedia.org/wikipedia/commons/thumb/8/87/PCR.svg/300px-PCR.svg.png |
Here are a few more indepth resources which further explain the PCR process:
Video presentation and animation by BrightStorm (http://www.brightstorm.com/science/)
|
eLesson by Deana Namuth entitled Polymerase Chain Reaction (2004) provides a step by step approach to the PCR. She summarizes her lesson as follows: The polymerase chain reaction laboratory technique is used in a variety of applications to make copies of a specific DNA sequence. This lesson describes how a PCR reaction works, what it accomplishes and its basic requirements for success. Examples of interpreting results are given. PCR's strengths, weaknesses and applications to plant biotechnology are explained. |
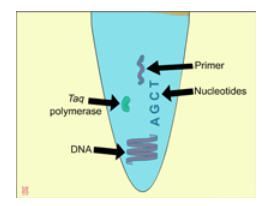 |
Cartoon animation by Leah Sandall depicts the process of PCR. Each component involved in the process is outlined and described in this animation.
Closer Look at Primers
An important component of PCR is the primer(s), which are short sequences of DNA (typically 10-30 base pairs long) that help initiate the synthesis process and also determine exactly which region(s) of DNA will be amplified. The design of primer sequences exploits the complementarity property of the DNA molecule. In the example below, the target sequence to be amplified (the "template") is shown in blue, and a possible primer sequence (18 bases in this case) is shown in red. Keep in mind that the primer sequences can be located anywhere along the template sequence, but must flank the key area of interest (the target). Notice the pairing of G-C and A-T.
![]()
The molecular biologist will determine the best primer sequences for the particular experiment or application. Designing good primers involves understanding some other concepts of DNA synthesis:
• the melting temperature of the double-stranded DNA (to know what annealing temperature to use for your PCR)
• the stability and relative GC content (GC bonds are more stable than AT bonds, which affects the melting temperature)
• avoiding complementarity within the primer sequence, as this inhibits proper annealing
Fortunately there are a number of software programs to help you design your primers, many of which are freely available on the internet (see for example http://bioinfo.ut.ee/primer3-0.4.0/primer3/ ). Once you have determined the best sequence to use for your primers, they can be purchased from any DNA synthesis facility.
Now that we have discussed in general terms the use of molecular markers and how they work, let’s next look more closely at different types of markers which you may choose to use in your plant breeding program. As mentioned earlier, most of the previously used molecular marker types have become obsolete now that SNPs have gained in popularity. SNPs have many advantages, including being high-throughput and low in cost. One older marker type, SSRs, are also still being used as of this writing, however, so are also included here. We will now briefly describe both of these marker types, starting first with SSRs.
Microsatellites (SSRs)
Microsatellites, also called simple sequence repeats (SSRs), are tandemly arranged blocks of short nucleotide sequences, usually 1-10 nucleotides long (though more typically 2 or 3), repeated up to 50 times within the plant genome. The number of repeat units in the block can vary noticeably between individuals within a species. This variation can be targeted by PCR, by placing the primers either side of the block. This leads to highly reproducible, co-dominant, easily analyzed and polymorphic markers. As a result, SSRs represent one of the most widely used markers in MAB.
|
|
Figure 7: An illustration of a microsatellite motif, (Image by Theresa Fulton.) [ In genetics a sequence motif is a nucleotide or amino-acid sequence pattern that is widespread and has, or is thought to have, a biological significance] |
In Figure 7, the di-nucleotide motif “AG” is repeated 6 times in this example of a microsatellite. Primers would be designed from the sequence of the red flanking sequences. (See Powell et al. 1996)
Note that the differences seen (the polymorphisms) between organisms are due to the number of repeats, which leads to a difference in size of the amplified products (ie. The length of the DNA segment between the 2 primers), not a difference in the DNA sequence per se. This is illustrated in Figure 8-a below.
In this example, the amplified fragment from A is shorter than that from B, because the AG motif is repeated fewer times. As a result, the A amplicon runs faster through the gel than the B amplicon, and the polymorphism is recognized by the different positions of the bands (Figure 8-b).
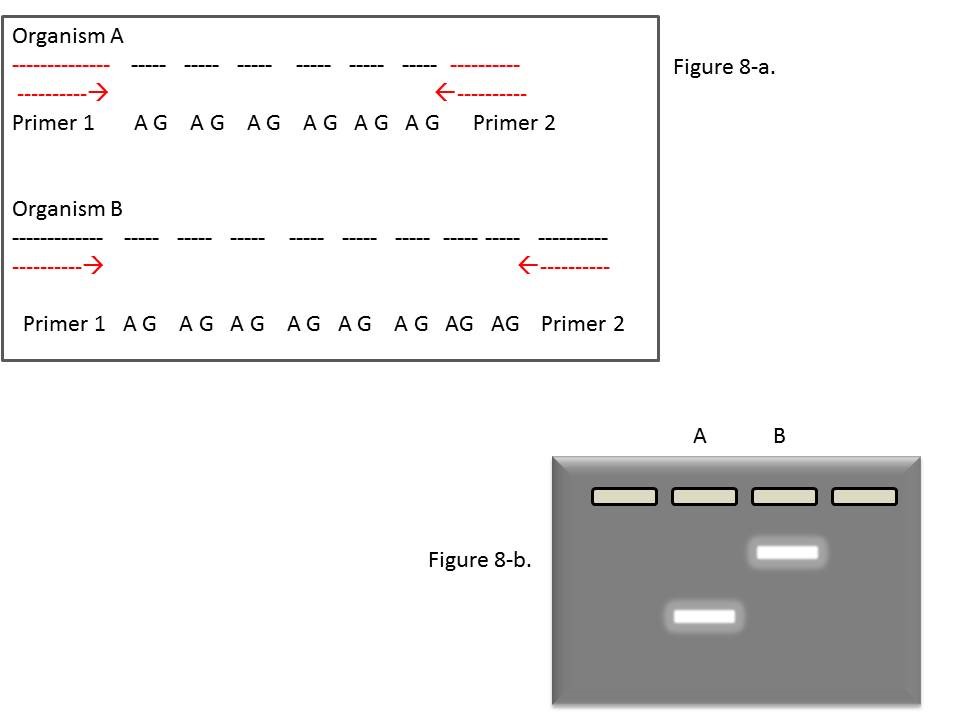
Figure 8: Further illustrations of repeated motifs in two organisms. Note the difference (polymorphism) in the number of repeats.
Image by Theresa Fulton and Deana Namuth-Covert.
SNPs (pronounced “snips”) are differences in DNA sequence of just one (or sometimes a small number of) nucleotides. Where these differences occur within a genic sequence, they are more often than not phenotypically neutral, but sometimes they can be associated with a change in the amino acid sequence of the gene product. They are very common, and are distributed throughout the genome. SNP genotyping can be relatively simple, but SNP discovery generally requires extensive DNA sequencing. However, because much of the procedure is automated, the price of SNPs is much less than earlier types of markers including SSRs, so SNPs now dominate the molecular breeding field.
Genotyping is the process of determining the genetic constitution-the genotype-of an individual plant by examining their DNA sequence using biological assays and comparing it to another individual’s sequence or a reference sequence.
Plant phenotyping is the comprehensive assessment of plant complex traits such as growth, development, tolerance, resistance, architecture, physiology, ecology, yield, and the basic measurement of individual quantitative parameters that form the basis for the more complex traits. Examples for such direct measurement parameters are image-based projected leaf area, chlorophyll fluorescence, stem diameter, plant height/width, compactness, stress pigment concentration, tip burn, internode length, colour, leaf angle, leaf rolling, leaf elongation, seed number, seed size, tiller number, flowering time, germination time etc[.: www.lemnatec.com/plant-phenotyping]
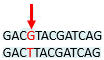
Figure 9. The figure below is an example of a SNP between 2 small DNA sequences. The sequences are the same order of nucleotides except for the one in red. This SNP would be designated as G:T, since one organism has a G (guanine) at this location of the genome while the other organism has a T (thymine).
For a review of “next generation” sequencing technologies, see: Shendure and Hanlee 2008.
One SNP at a time
High-throughput systems are based on high-throughput! Figure 9 shows typical plates that are used for SNP genotyping, which can hold 96 or 384 samples at once. Therefore you generally can’t run just one SNP marker at a time. However a SNP can be converted into a single use marker for Marker Assisted Breeding by a number of techniques, such as CAPs (Cut/Cleaved Amplified Polymorphism).
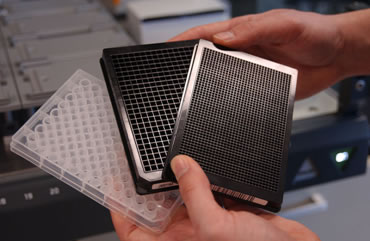 |
Figure 9a: Plates used for SNP genotyping. Image from http://www.wellplate.com/the-history-of-the-microplate/. |
If a SNP falls on an enzyme restriction site (Restriction sites, or restriction recognition sites, are locations on a DNA molecule containing specific (4-8 base pairs in length sequences of nucleotides, which are recognized by restriction enzymes) , primers can be designed so that a simple PCR assay discriminates the alleles following an enzyme digest. This process converts a SNP that is part of a larger assay to one that can be genotyped individually. Some DNA sequence information is needed to create such an assay, however. But this can be very useful for a marker that has special importance, for example one that is tightly linked to a disease resistance gene.
Figure 10, from Varshney et.al. 2007, is a gel showing 12 chickpea lines genotyped with a CAPS assay developed for a SNP marker. In this case, the scientists used DNA sequence information previously identified with ESTs (expressed sequence tags) to pinpoint a region that could be differentiated with a restriction enzyme; then, primers were designed to amplify that region. This new marker shows polymorphism in line 5, differentiating that line from the other chickpea lines.
See the Varshney et al. ICRISAT publication for more information (Varshney RK, Nayak S, Jayashree B, Eshwar K, Upadhyaya HD, Hoisington DA: Development of cost-effective SNP assays for chickpea genome analysis and breeding.
SAT eJournal 2007, 3:1-3.)
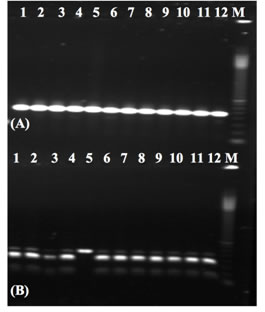 |
Image from Varshney et.al. 2007. |
ARMS Tetra-primer system
The amplification refractory mutation system (ARMS) is another method of creating an assay for one particular SNP. This uses an amplification strategy in which polymerase chain reaction (PCR) primers are designed in such a way that they are able to discriminate among templates that differ by a single nucleotide, thus converting a SNP into a simple PCR assay, albeit generally one with 4 primers. The trial-and-error procedure to develop an assay in this way can be time-consuming, so is used only for markers of special importance.
Using molecular marker technology plant breeders are able to select individual plants based on their marker pattern( genotype) as opposed to their phenotype. This process is called marker assisted breeding ( MAB) or marker assisted selection ( MAS). The most important requirement for MAB is to identify a convenient marker(s) closely linked to a gene(s) of interest. In this lesson we covered the desirable qualities of markers and the different molecular marker types and their suitability for application. Considering that MAB studies are DNA studies, the structure and organization of DNA and DNA extraction protocols, were covered as well as the PCR technology used to replicate DNA of interest and the primer design that goes with the PCR process. The next section will discuss the selection of germplasm and genetic diversity
References Cited
Mullis,K., Faloona,F., Scharf,S., Saiki,R., Horn,G. and Erlich,H.
(1986) Specific enzymatic amplification ofDNAin vitro: the polymerase
chain reaction. Cold Spring Harb. Symp. Quant. Biol., 51,
263–273.
Powell,WalterW., Kenneth Koput, and Laurel Smith-Doerr. 1996. “Interorganizational
Collaboration and the Locus of Innovation: Networks of Learning in Biotechnology.”
Administrative Science Quarterly 41 (1): 116–45.
Shendure, J and Hanlee, J. 2008. Next-generation DNA sequencing. Nature Biotechnology 26, 1135 - 1145 (2008) Published online: 9 October 2008 | doi:10.1038/nbt1486
Varshney RK, Nayak S, Jayashree B, Eshwar K, Upadhyaya HD, Hoisington DA. 2007. Development of cost-effective SNP assays for chickpea genome analysis and breeding. SAT eJournal 2007, 3:1-3.)